Details of the mechanisms for enhancing fluorescence using photonic crystal structures and the detection instrument developed for enhanced fluorescence and label-free imaging are described below. Applications for this approach being developed by the group are also discussed.
Photonic crystal-enhanced excitation and extraction
Enhanced excitation
Enhancing the output of fluorescent species is highly desirable for a wide range of biological applications including DNA sequencing, gene expression, single-molecule detection and high-resolution cell imaging. An extensive literature exists on the effects of metals on fluorophores and on the use of a variety of metal surface configurations or metallic particles that involve plasmonic resonances to enhance fluorescence. A relatively smaller variety of dielectric structures, such as waveguides and optical resonators, have been exploited for this purpose.
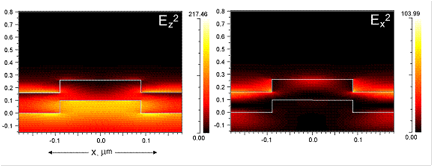
The guided-mode resonance (GMR) effect occurring in photonic crystal slabs leads to heightened energy density within the resonator under steady-state operation conditions (via continual reinforcement of the leaky modes by the externally incident illumination), the magnitude of which is directly related to the resonance quality factor. A high resonance Q-factor leads to high intensity near-fields with which fluorophores can interact and fluoresce with greater intensity due to an enhanced absorption rate. The electric near-fields produced by a device in response to TM polarized incidence are shown in Fig. 1, which shows the electric field intensity (Ez2, Ex2). As is evident, the maximum near-field intensity occurs where the resonant mode is confined, with evanescent tails penetrating both the substrate and superstrate of the device. For the purpose of fluorescence enhancement, these enhanced fields represent greater incident energy density.
Example of enhancement in detection sensitivity: Detecting Cy-5 conjugated Streptavidin
Enhanced extraction
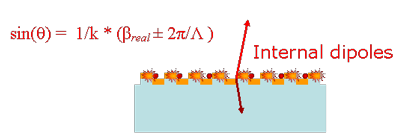
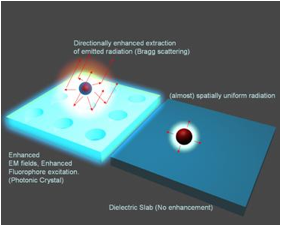
The existence of leaky modes that overlap the fluorescence emission spectrum opens up pathways for the emitted light to escape into free-space. Besides direct emission, the fluorescence can now couple to the overlapping leaky modes and Bragg scatter out of the structure, thereby greatly reducing the amount of light trapped as guided modes, in comparison to an unpatterned substrate. If the dispersion of these overlapping leaky modes is close to the Г-point band-edge, i.e., K|| (magnitude of in-plane wave vector) ~ 0, most of the emitted light will be extracted within small angles with the surfaced normal. More generally, appropriately engineering the leaky dispersion of the PC facilitates the funnelling of guided light into regions of space where it can be easily detected.
Detection instrument for enhanced-fluorescence and label-free imaging on photonic crystal surfaces
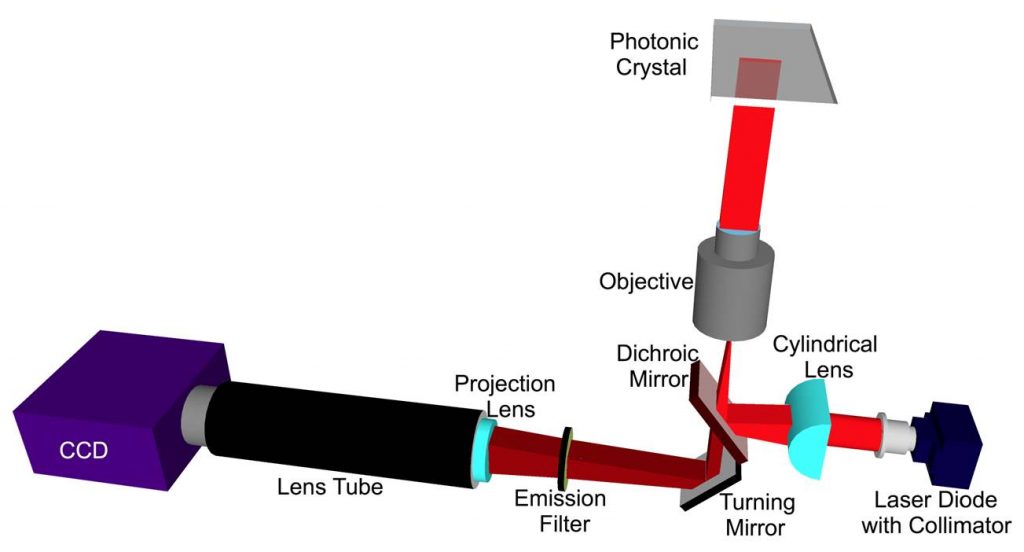
We have shown that the greatest PCEF enhancement factors are achieved through the use of collimated, rather than focused, laser illumination. The resonant coupling condition for enhanced excitation occurs for a narrow range of incident angles for a given illumination wavelength. Focused light provided by a confocal laser scanner contains a range of incident angles, of which only a fraction can fully engage in resonant coupling. However, obtaining lowest detection limits for fluorescence relies upon using the high illumination intensity provided by focused laser beams. Because the PC structure is a linear grating, it can couple efficiently with light that is collimated in the axis perpendicular to the grating lines, while the coupling efficiency is not affected by the incident angle in the direction parallel to the grating lines. Our group has designed and constructed a PCEF microarray detection instrument that provides collimated illumination and the ability to tune the incident angle to precisely match the resonant coupling condition while focusing the light from a fiber-coupled semiconductor laser to an 8 µm line with a cylindrical lens. This system has been used to achieve a 140x lower limit of detection compared to a conventional glass substrate. The design of this new system will be adopted for this project. (Details in Figure 5.)
Gene expression microarrays
The use of microarrays to determine gene expression levels from biological samples has become an extremely informative procedure for life sciences researchers. These DNA microarrays promise to impact the practice of medicine, particularly in the diagnosis and treatment of cancer. Currently microarrays are performed on glass microscope slides and are capable of discerning large changes in gene expression between two biological tissues. However, these microarrays are not capable of accurately determining smaller changes on the order of a few to dozens of nucleic acid molecules. By using photonic crystals as the substrate to perform the microarray, we can take advantage of unique nanoscale optical effects to more strongly excite the fluorescent molecules used to tag the nucleic acid molecules. Fluorescence from excited molecules can be further enhanced by altering the direction of emitted light to be more efficiently detected by the microarray instrumentation. The result of this enhancement is an increase in the signal-to-noise ratio of the DNA microarray, which enables more accurate quantification of small changes in amounts of DNA present. Because the photonic crystals we work with can be fabricated over large areas and easily integrated onto microscope slides, we can perform DNA microarray experiments with the same commercial microarray equipment used throughout many labs all over the world. We are collaborating with Prof. Lila Vodkin of the Department of Crop Sciences here at Illinois to apply our photonic crystals to soybean genome microarray experiments in order to assess the performance of our photonic crystal substrate.
Disease biomarker detection
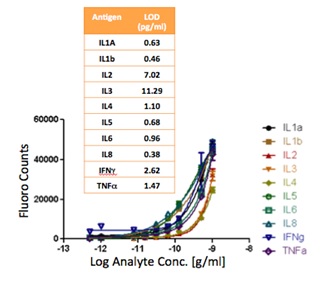
Human serum contains a complex mix of proteins from many sites in the body that can potentially indicate a range of disease states if the relative concentrations of specific proteins associated with disease show dramatic changes. While concentrations of a single protein in serum may yield enough information to justify that protein’s use as a biomarker, it may be more informative to measure the concentrations of multiple proteins at once to achieve a protein concentration profile, just as gene expression profiles are often generated. Many researchers are exploring the use of the microarray format in immunofluorescent protein detection in order to efficiently measure the serum concentrations of many proteins at once. These sandwich immunofluorescent microarrays are often performed on glass slide substrates, but their performance can be improved by performing them on photonic crystal substrates capable of supporting enhanced fluorescence. The nanoscale optical properties of photonic crystals can increase the excitation of the fluorescent molecules used to tag the assay antibodies, and these properties also help to steer the emitted light towards the detection instrumentation. These effects can help increase the signal-to-noise ratio of immunofluorescent assays, providing increased resolution and lower limits of detection. We are currently characterizing the impact of photonics crystal-enhanced fluorescence on the detection of the cytokine Tumor Necrosis Factor-a (TNF-a), which plays a role in inflammation.
Breast cancer biomarker detection
Protein biomarkers in blood have a great deal of promise for facilitating personalized medicine, including detection, diagnosis, prognosis, and monitoring of therapy. Even so, it is widely recognized that these circulating biomarkers are highly variable across individuals, and that it will likely be necessary to utilize a panel of blood biomarkers to accurately detect or characterize a disease. Although many approaches have been proposed for multiplexed biomarker analysis, most of these lack the sensitivity to detect the low-abundant proteins that are likely to be useful as biomarkers. Using a photonic crystal surface to enhance the fluorescence output from a biomarker microarray, it is our goal to automate this platform to enable more rapid, high-sensitivity detection and a simplified output that will be readily usable by a clinician. Our goal is to develop a more compact, inexpensive and practical instrument than current, alternative approaches.
Breast cancer is one of several diseases where diagnostic analysis of low-abundance protein biomarker diagnostics is likely to be beneficial. Most breast cancer deaths are caused by metastatic disease, highlighting the importance of regular screening for early detection. However, existing screening methods have major shortcomings regarding early detection of breast cancer. Notably, these approaches cannot distinguish cancer from benign breast disease and sometimes even normal breast tissue, resulting in high rates of false positives. The high false-positive rate can be stressful for women, and leads to unnecessary biopsies. New tests that complement mammography could improve the chances of successful medical intervention when breast cancer does occur, reduce stress associated with false-positive screens, and generally help to restore faith in a useful, if imperfect, screening tool.
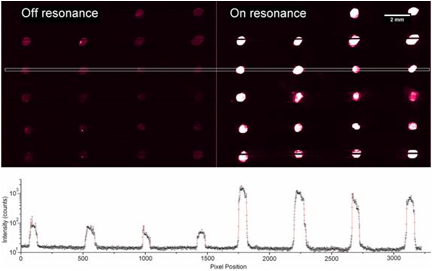
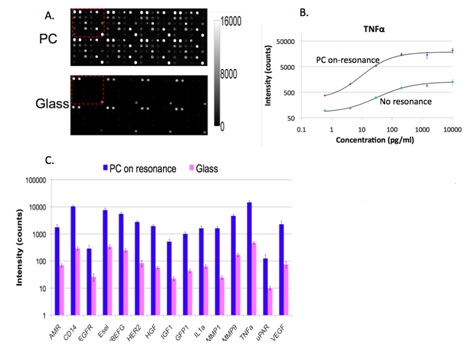
We collaborated with Dr. Zangar and demonstrated PCEF for a breast cancer microarray with >20 multiplexed assays. Use of the PC resulted in an ~10x improvement in the limit of detection for all assays. The PC is designed to increase the fluorescence intensity of Cy5 dyes (or equivalent AlexaFluor dyes) through the enhanced excitation and extraction mechanisms described previously. The effects of PC-enhanced excitation can be determined by comparing the fluorescence output under the following two conditions: (a) when the excitation laser incident angle is adjusted to illuminate the PC at the resonant angle (“on-resonance”), and (b) when the excitation angle of incidence is selected to not coincide with the resonant coupling condition (“off-resonance”). Here, the on-resonant angle of illumination is ~0°, while the off-resonant angle is 20°. The fluorescent image of one block selected from the array exposed to the first dilution (maximum concentration divided by seven) is used to illustrate the observed signal enhancement when the PC is imaged on-resonance. The fluorescent images shown in Figure 2 are obtained using identical laser power and photomultiplier tube (PMT) gain settings in a commercially available confocal microarray scanner (Tecan LS). It can be observed in Figure 8 that by scanning the PC at its resonant angle, the fluorescence intensity is enhanced by factors of 11- to 20-fold.
In order to determine the limits of detection, it is necessary to characterize the noise in terms of the magnitude of background fluorescence and the standard deviation of control spot background intensity, where the negative control is a spot printed only with buffer. When the PC is on-resonance, the background intensity is ~4- to 5-fold higher compared to the off-resonance condition. Due to the enhanced electric field on the PC surface, at resonance, the PC enhances both the spot intensity as well as the background intensity. Even so, the overall signal-to-noise ratio for the assays are improved because the magnitude of the PC enhancement is greater within the capture spots than in the regions between the spots. We define the signal-to-noise ratio (SNR) as the slide background-substracted net spot intensity divided by the standard deviation of slide background intensity. This metric represents how easily a spot can be distinguished from noise. As an example, we found that the increase in SNR is particularly important for detecting antigens EGFR and uPAR at concentrations as low as 3.6 and 7.1 pg/ml, respectively. When the PC is off-resonance, the spot signals for EGFR and uPAR at these same concentrations were noise limited (SNR <3), which is to say that their spot intensities cannot be differentiated from the noise of the fluorescence in regions between spots. In contrast, these same spots were easily detectable (SNR >8) when the PC was at resonance.
The signal intensities from each dilution in the concentration series were used to generate standard curves using the Protein Microarray Analysis Tool (ProMAT) software, developed by PNNL. As an example, Figure 9 shows the standard curves for TNFα when the PC is on-resonance and off-resonance. The sensitivity is defined as the change in signal per unit change in concentration. A more pronounced change in the output signal for a given change in the concentration is desirable, as such a system can more accurately detect small changes in the concentration. We found that when on-resonance, the PC demonstrated better precision as indicated by the steeper slope in the linear region of the standard curves.
Related Publications
- “Combined enhanced fluorescence and label-free biomolecular detection with a photonic crystal surface,” P.C. Mathias, N. Ganesh, L.L. Chan, and B.T. Cunningham, Appl. Opt. 46, 2351-2360, 2007
- “Enhanced fluorescence emission from quantum dots on a photonic crystal surface,” N. Ganesh, W. Zhang, P.C. Mathias, E. Chow, J.A.N.T. Soares, V. Malyarchuk, A.D. Smith & B.T. Cunningham, Nature Nanotechnology 2, 515-520, 2007
- “Distance dependence of fluorescence enhancement from photonic crystal surfaces,” N. Ganesh, P.C. Mathias, W. Zhang, and B.T. Cunningham, J. Appl. Phys. 103, 083104, DOI:10.1063/1.2906175, 2008
- “Graded wavelength one-dimensional photonic crystal reveals spectral characteristics of enhanced fluorescence,” P.C. Mathias, N. Ganesh, W. Zhang, and B.T. Cunningham, J. Appl. Phys. 103, 094320, DOI:10.1063/1.2917184, 2008
- “Enhanced Fluorescence on a Photonic Crystal Surface Incorporating Nanorod Structures,” W. Zhang, N. Ganesh, P.C. Mathias, and B.T. Cunningham, Small, Vol. 4, No. 12, p. 2199-2203, 2008.
- “Photonic crystals with SiO2-Ag ‘post-cap’ nanostructure coatings for surface enhanced Raman spectroscopy,” S.-M. Kim, W. Zhang, and B.T. Cunningham, Applied Physics Letters, Vol. 93, p. 143112, DOI: 10.1063/1.2998695, 2008.
- “Leaky-mode assisted fluorescence extraction: Application to fluorescence enhancement biosensors,” N. Ganesh, I.D. Block, P.C. Mathias, W. Zhang, E. Chow, V. Malyarchuk, and B.T. Cunningham, Optics Express, Vol. 16, No. 26, p. 21626-21640, 2008.
- “Application of Photonic Crystal Enhanced Fluorescence to a Cytokine Immunoassay,” P.C. Mathias, N. Ganesh, and B.T. Cunningham, Analytical Chemistry, Vol. 80, No. 23, p. 9013-9020, 2008.
- “Employing two distinct guided-mode resonances to improve fluorescence enhancement from photonic crystals,” P.C. Mathias, H.-Y. Wu, and B.T. Cunningham, Applied Physics Letters, Vol. 95, p. 021111-021113, 2009.
- “Optimizing the spatial resolution of photonic crystal label-free imaging,” I.D. Block, P.C. Mathias, S.I. Jones, L. O. Vodkin, and B.T. Cunningham, Applied Optics, 2009.
- “A detection instrument for enhanced fluorescence and label-free imaging on photonic crystal surfaces,” I.D. Block, P.C. Mathias, N. Ganesh, S.I. Jones, B.R. Dorvel, V. Chaudhery, L. Vodkin, R. Bashir, and B.T. Cunningham, Optics Express, Vol. 17 Issue 15, pp.13222-13235, 2009.
- “Magnification of photonic crystal fluorescence enhancement via TM resonance excitation and TE resonance extraction on a dielectric nanorod surface,” H.-Y Wu, W. Zhang, P.C. Mathias, and B.T. Cunningham, Nanotechnology, Vol. 21, p. 125203-125210, 2010.
- “Improved detection of differentially expressed genes on a DNA microarray by photonic crystal enhanced fluorescence,” P.C. Mathias, S. I. Jones, H.-Y. Wu, F. Yang, D.O. Gonzalez, L.O. Vodkin, and B.T. Cunningham, Analytical Chemistry, Vol. 82, No. 16, p. 6854-6861, 2010.
- “Multi-color fluorescence enhancement from a photonic crystal surface,” A. Pokhriyal, M. Lu, C. Huang, S.C. Schulz, and B.T. Cunningham, submitted to Applied Physics Letters, Vol. 97, No. 12, p. 121108-121110, 2010. PMCID: PMC2955725
- “Photobleaching on photonic crystal enhanced fluorescence surfaces,” V. Chaudhery, M. Lu, C.S. Huang, S. George, and B.T. Cunningham, Journal of Fluorescence, published online November 12, 2010, DOI 10.1007/s10895-010-0760-8.
- “Photonic crystal enhanced fluorescence using a quartz substrate to reduce limits of detection,” A. Pokhriyal, M. Lu, V. Chaudhery, C.-S. Huang, S. Schulz, and B.T. Cunningham, Optics Express, Vol. 18, No. 24, p. 24793-24808, 2010.
- “Application of photonic crystal enhanced fluorescence to cancer biomarker microarrays,” C.-S. Huang, S. George, M. Lu, V. Chaudhery, R. Tan, R.C. Zangar, and B.T. Cunningham, Analytical Chemistry, Vol. 83, No. 4, p. 1425-1430, 2011 (featured on cover).
- “Angle-scanning photonic crystal enhanced fluorescence microscopy,” V. Chaudhery, M. Lu, A. Pokhriyal, S. Schulz, and B.T. Cunningham, IEEE Sensors Journal, Accepted, September 2011.
- “Spatially selective photonic crystal enhanced fluorescence and application to background reduction for biomolecule detection assays,” V. Chaudhery, M. Lu, C.-S. Huang, A. Pokhriyal, J. Polans, S.C. Schulz and B.T. Cunningham, Optics Express, Vol. 19, No. 23, p. 23327–23340, 2011.
- “Multiplexed cancer biomarker detection using quartz-based photonic crystal surfaces,” C.-S. Huang, V. Chaudhery, A. Pokhriyal, S. George, J. Polans, M. Lu, R. Tan, R.C. Zangar, B.T. Cunningham, Analytical Chemistry, Vol. 84, No. 2, p. 1126-1133, 2012.
- “Photonic crystal enhanced fluorescence for early breast cancer biomarker detection,” B.T. Cunningham and R.C. Zangar, Journal of Biophotonics, Vol. 8-9, p. 617-628, 2012. (Invited Review, special issue, Lab-on-a-Chip Diagnostics, featured on cover).
- “A line-scanning detection instrument for photonics crystal enhanced fluorescence,” V. Chaudhery, M. Lu, C.-S. Huang, J. Polans, R. Tan, R.C. Zangar, and B.T. Cunningham, Optics Letters, Vol. 37, No. 13, p. 2565-256, 2012.
- “Coupled External Cavity Photonic Crystal Enhanced Fluorescence,” A. Pokhriyal, M. Lu, C. Ge and B.T. Cunningham, Journal of Biophotonics (2012), doi: 10.1002/jbio.201200173
- “Nanostructured surfaces and detection instrumentation for photonic crystal enhanced fluorescence (invited review),” V. Chaudhery, S. George, M. Lu, A. Pokhriyal, and B.T. Cunningham, Sensors Journal, Vol. 13, p. 5561-5584, 2013.
- “Enhanced fluorescence emission using a photonic crystal coupled to an optical cavity,” A. Pokhriyal, M. Lu, V. Chaudhery, S. George, and B.T. Cunningham, Applied Physics Letters,Vol. 102, pp. 221114-221116, 2013.
- “Sensitive Detection of Protein and miRNA Cancer Biomarkers using Silicon-Based Photonic Crystals and A Resonance Coupling Laser Scanning Platform,” S. George, V. Chaudhery, Y. Tan, M. Lu, and B.T. Cunningham, Lab on a Chip, Vol 13, p. 4053-4064, 2013.
- “Photonic Crystal Enhancement of a Homogeneous Fluorescent Assay using Submicron Fluid Channels Fabricated by E-jet Patterning,” Y. Tan, E. Sutanto, A.G. Alleyne, and B.T. Cunningham, Journal of Biophotonics, Accepted, December 2013.
Related conference presentations
- “Enhanced fluorescence via photonic crystal slabs incorporating nanorod structures,” W. Zhang, N. Ganesh, P.C. Mathias, and B.T. Cunningham, Conference on Lasers and Electro Optics, San Jose, CA, May 2008.
- “Distance dependent amplification of molecular fluorescence via photonic crystal slabs,” N. Ganesh, P.C. Mathias, W. Zhang, and B.T. Cunningham, Conference on Lasers and Electro Optics, San Jose, CA, May 2008.
- “Combined Enhanced Fluorescence and Label-Free Biomolecular Sensing with a Two-Dimensional Photonic Crystal.” P.C. Mathias, N.Ganesh, and B.T. Cunningham, IEEE LEOS Conference, Orlando, FL, October 2007.
- “Photonic crystal enhanced fluorescence,” N. Ganesh and B.T. Cunningham, 2007 CLEO/QELS Conference, Baltimore, MD, May 2007.
- “Resonant enhancement of fluorescence from Quantum Dots on a Photonic Crystal Slab,” N. Ganesh, W. Zhang, P.C. Mathias, and B.T. Cunningham, 2007 MRS Fall Meeting, San Francisco, CA, April